81
Portfolio DataPulse™
8/10
Projects On Track
4
Active Donors
✦ For NGO Directors · Country Heads · Senior Leadership

The board meeting
starts with facts
now.

MetriqOS Portfolio Intelligence gives senior leadership a live, cross-portfolio view — health matrix, reach trends, budget pipeline, donor alignment — without waiting for the quarterly report from each project team.

Portfolio Health Matrix
Live · 10 projects
Girls Ed.
● On track
TP 82 · DQ 87
WASH Mara
● On track
TP 79 · DQ 81
Nutrition
◐ Review
TP 61 · DQ 74
Livelihoods
● On track
TP 88 · DQ 90
Child Prot.
● On track
TP 76 · DQ 83
Health Sys.
⚠ At risk
TP 44 · DQ 68
Food Sec.
● On track
TP 83 · DQ 85
Skills Dev.
◐ Review
TP 58 · DQ 72
Advocacy
● On track
TP 91 · DQ 88
Climate
◌ Starting
TP — · DQ —
On track
Review
At risk
Starting
Portfolio Intelligence
Six views of your entire portfolio.
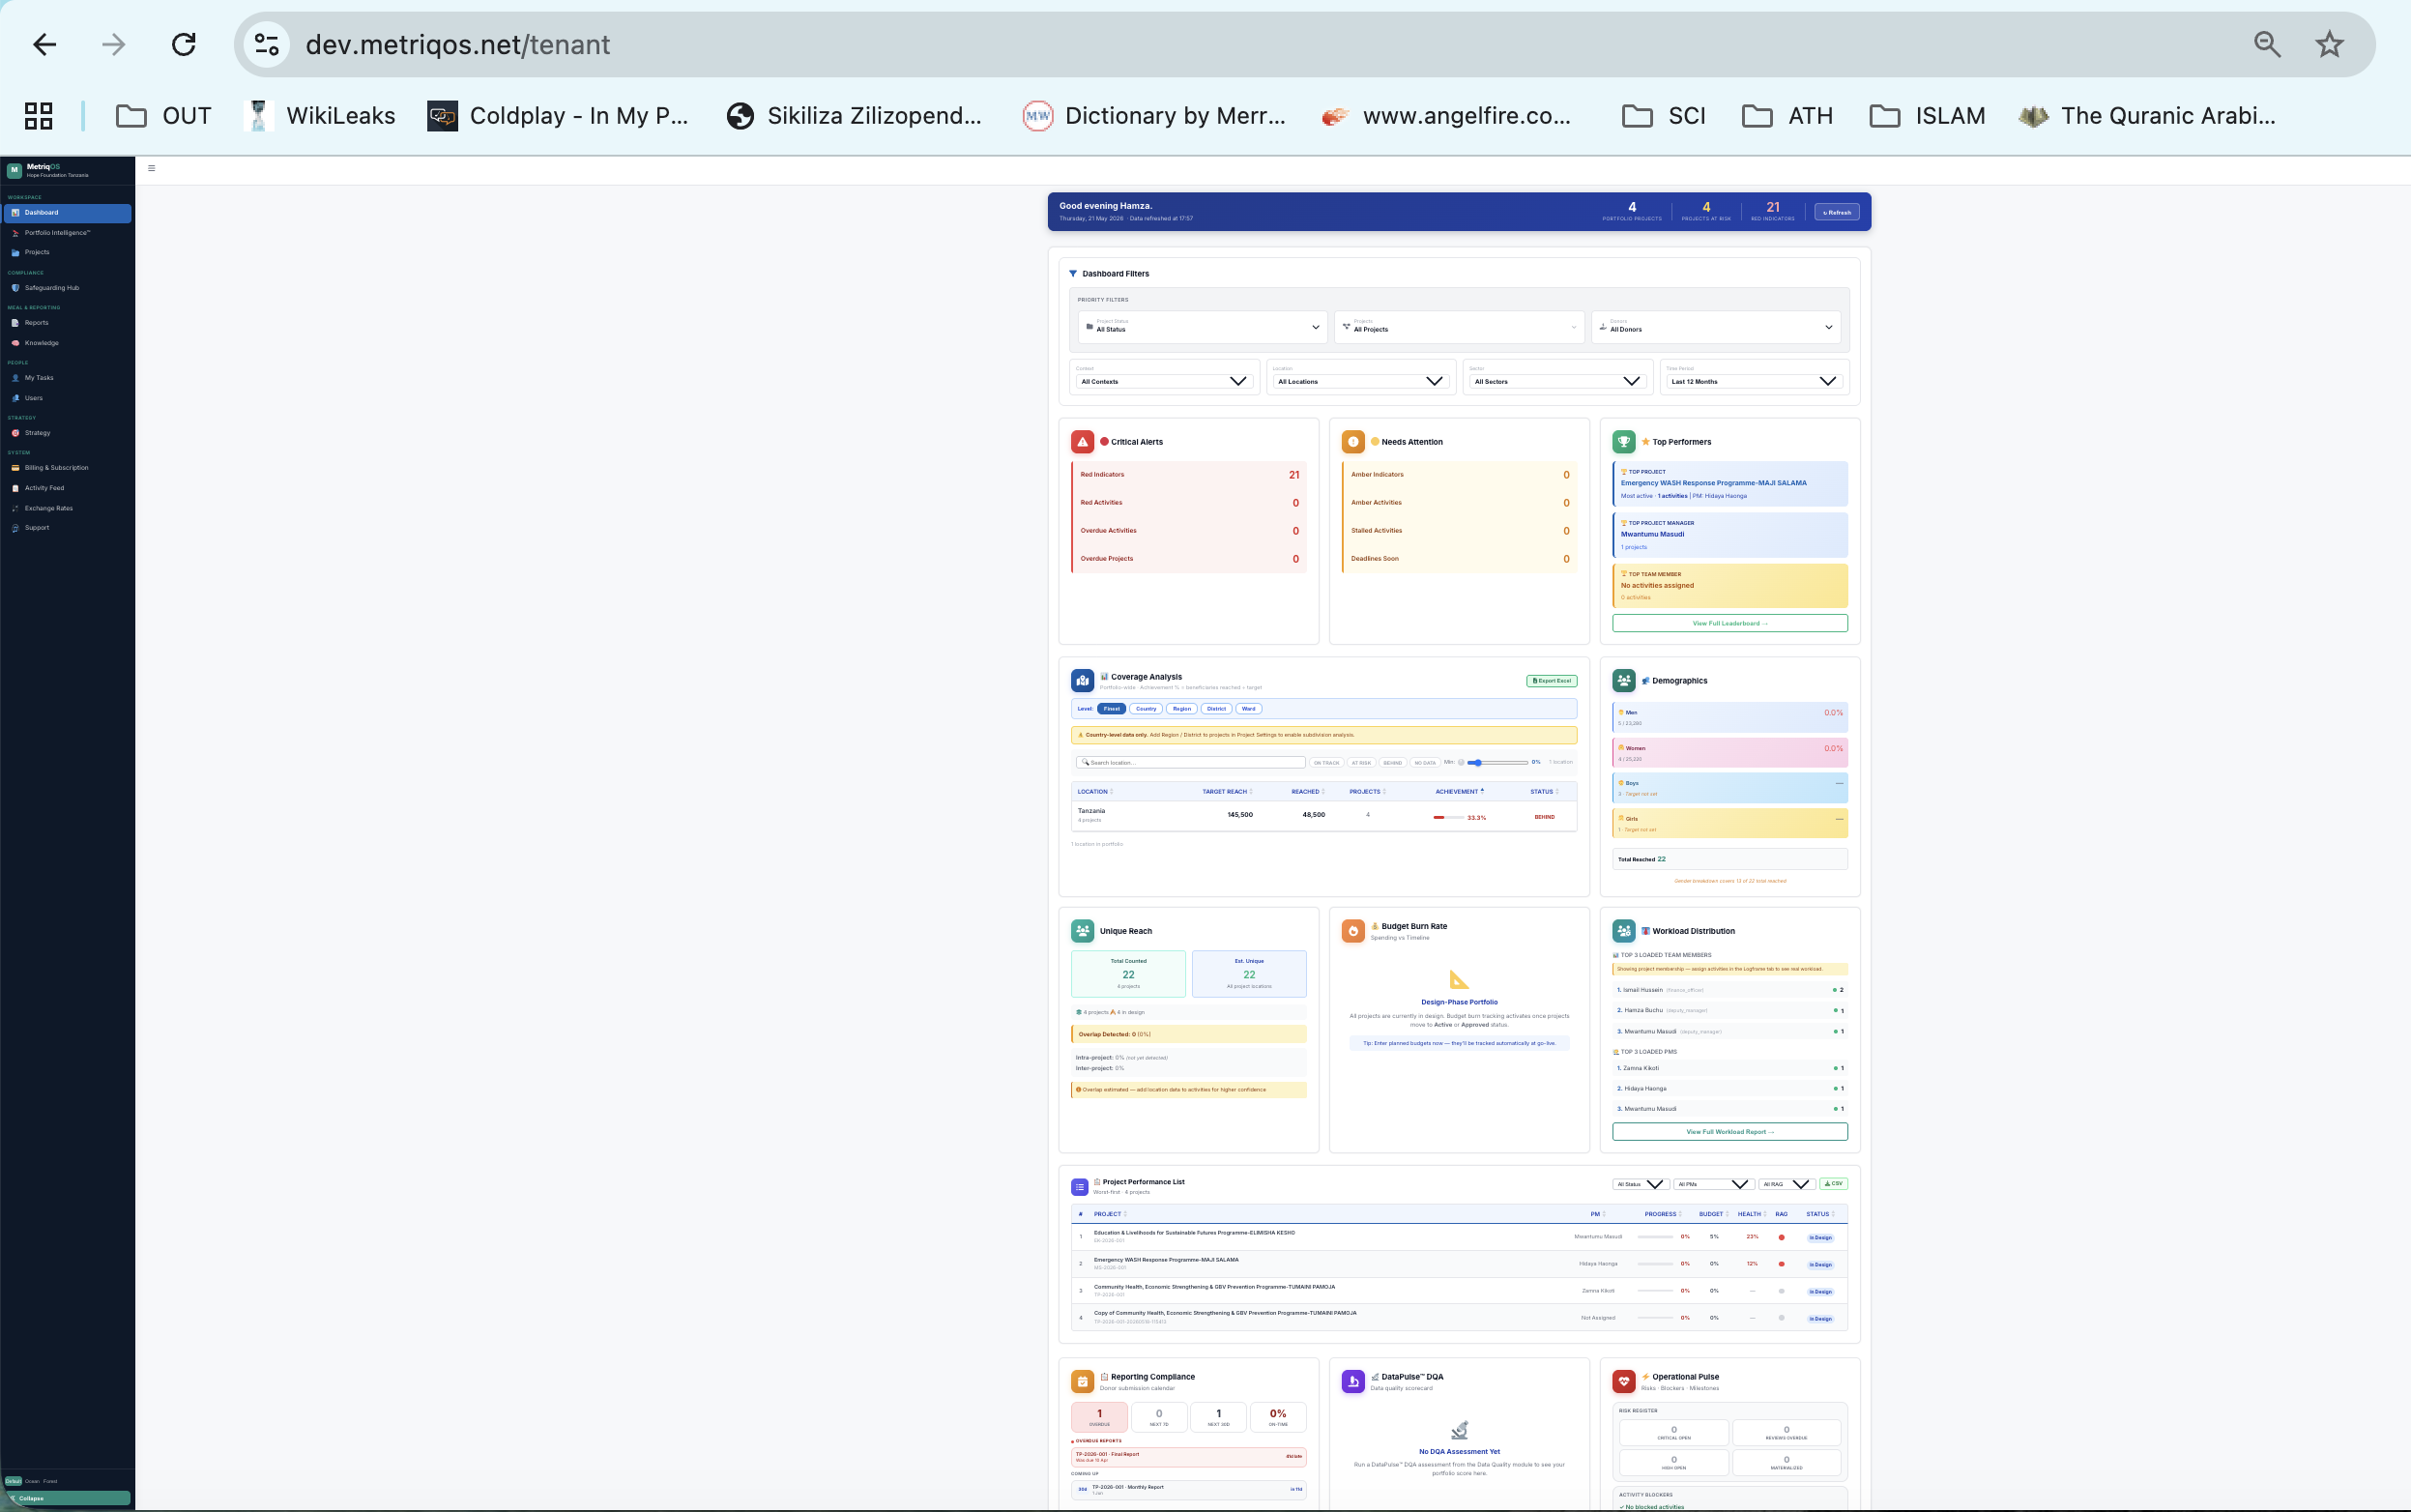
Not a report you wait for — a live dashboard you open. Every view updates as project teams record actuals, submit data, and update their plans.
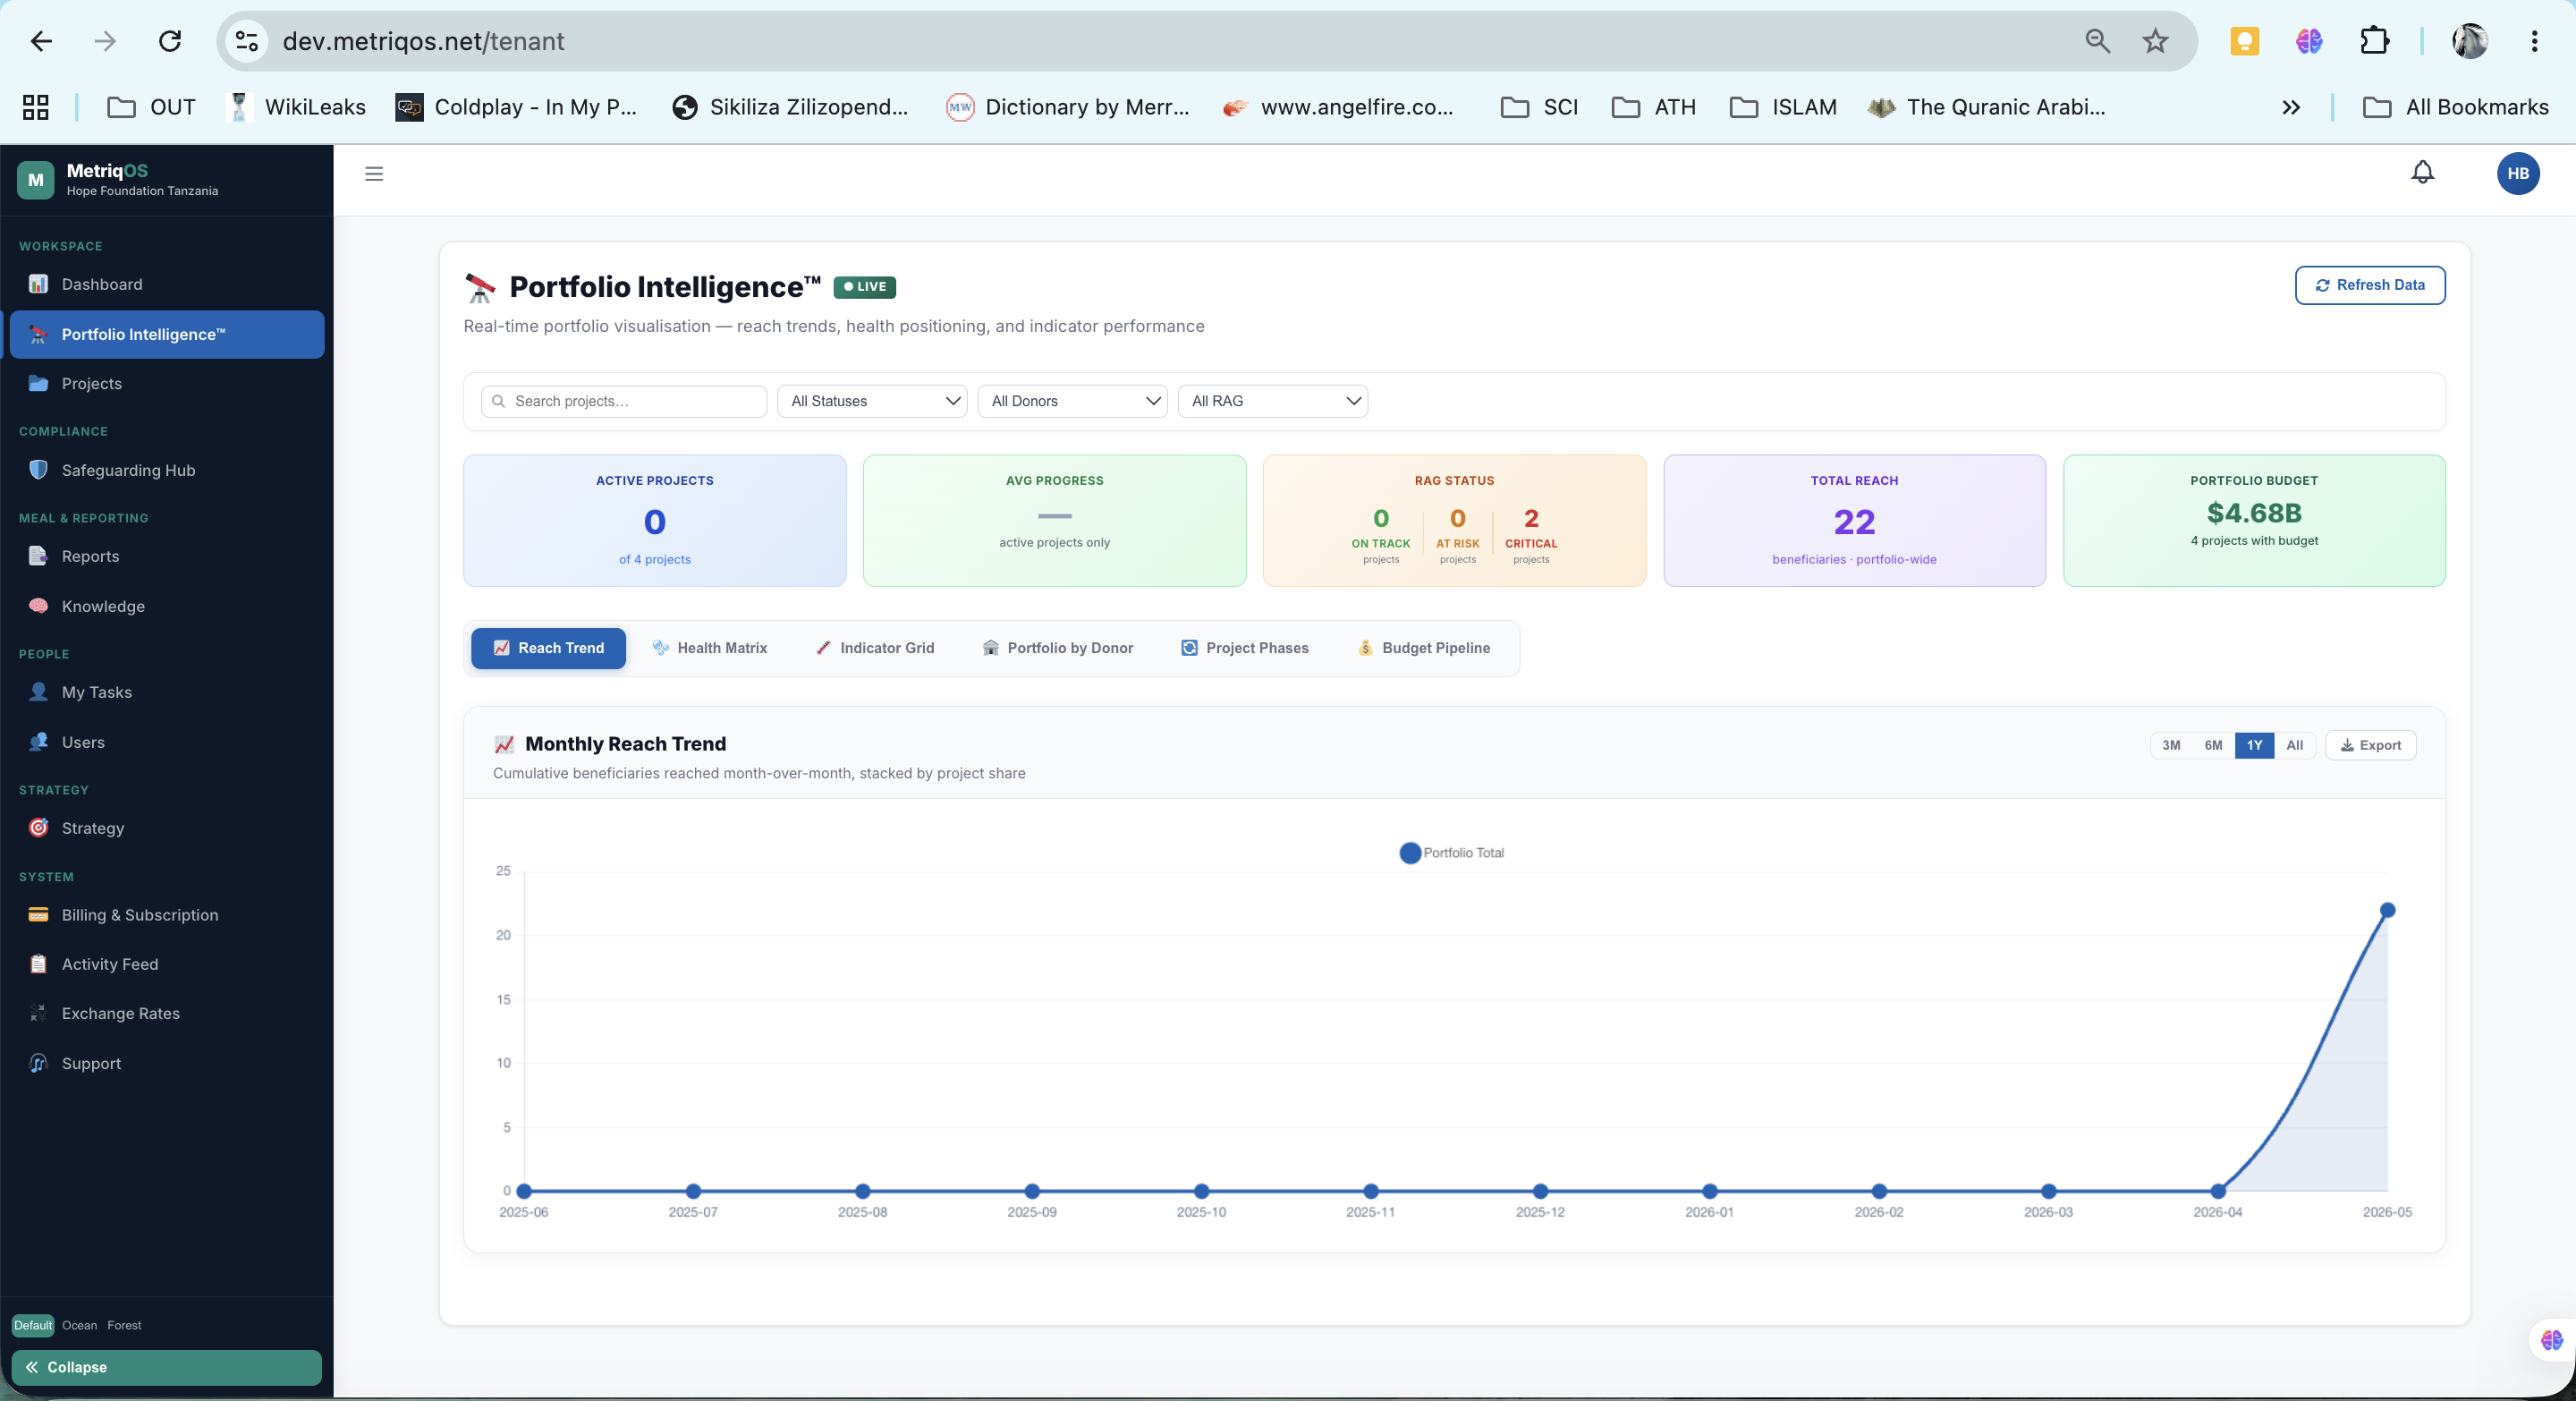
📈
Trend
Reach Trend
Cumulative beneficiary reach across all projects, plotted over time. See which projects are driving the curve and which are stalling.
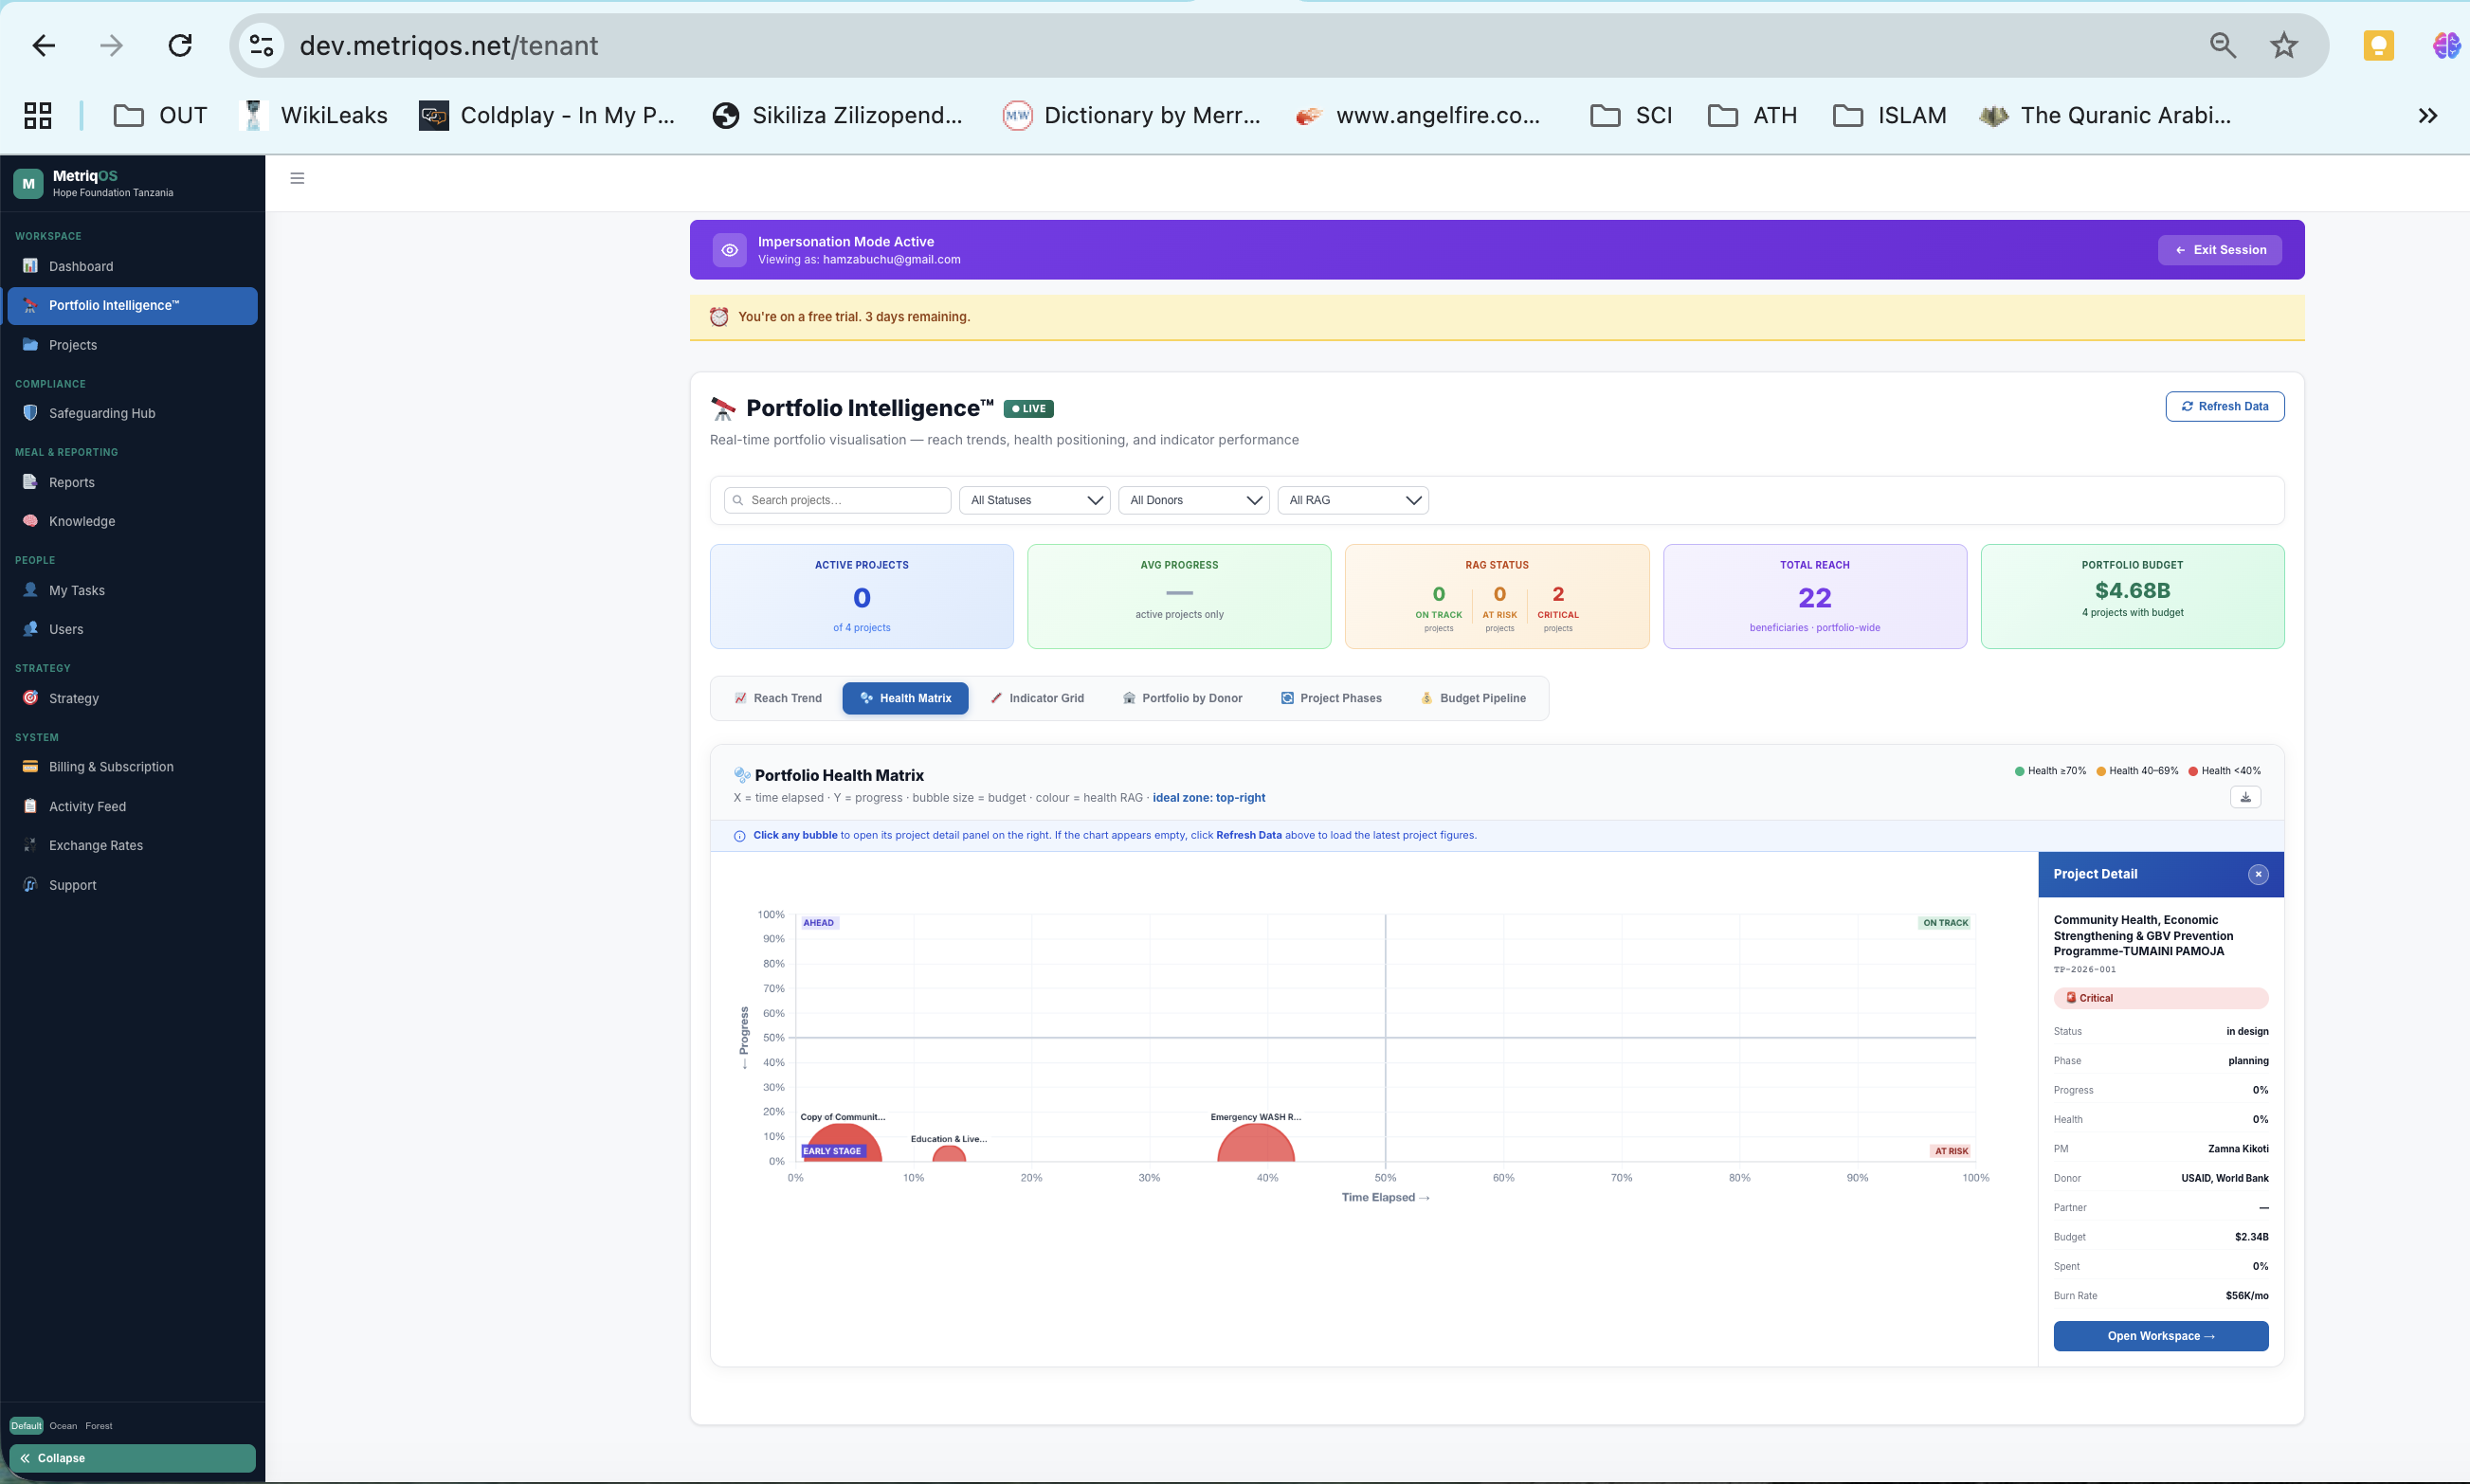
🟩
RAG Status
Health Matrix
Every project's TriPulse™ health and DataPulse™ quality score in one grid. Red cells demand attention before the quarterly review does.
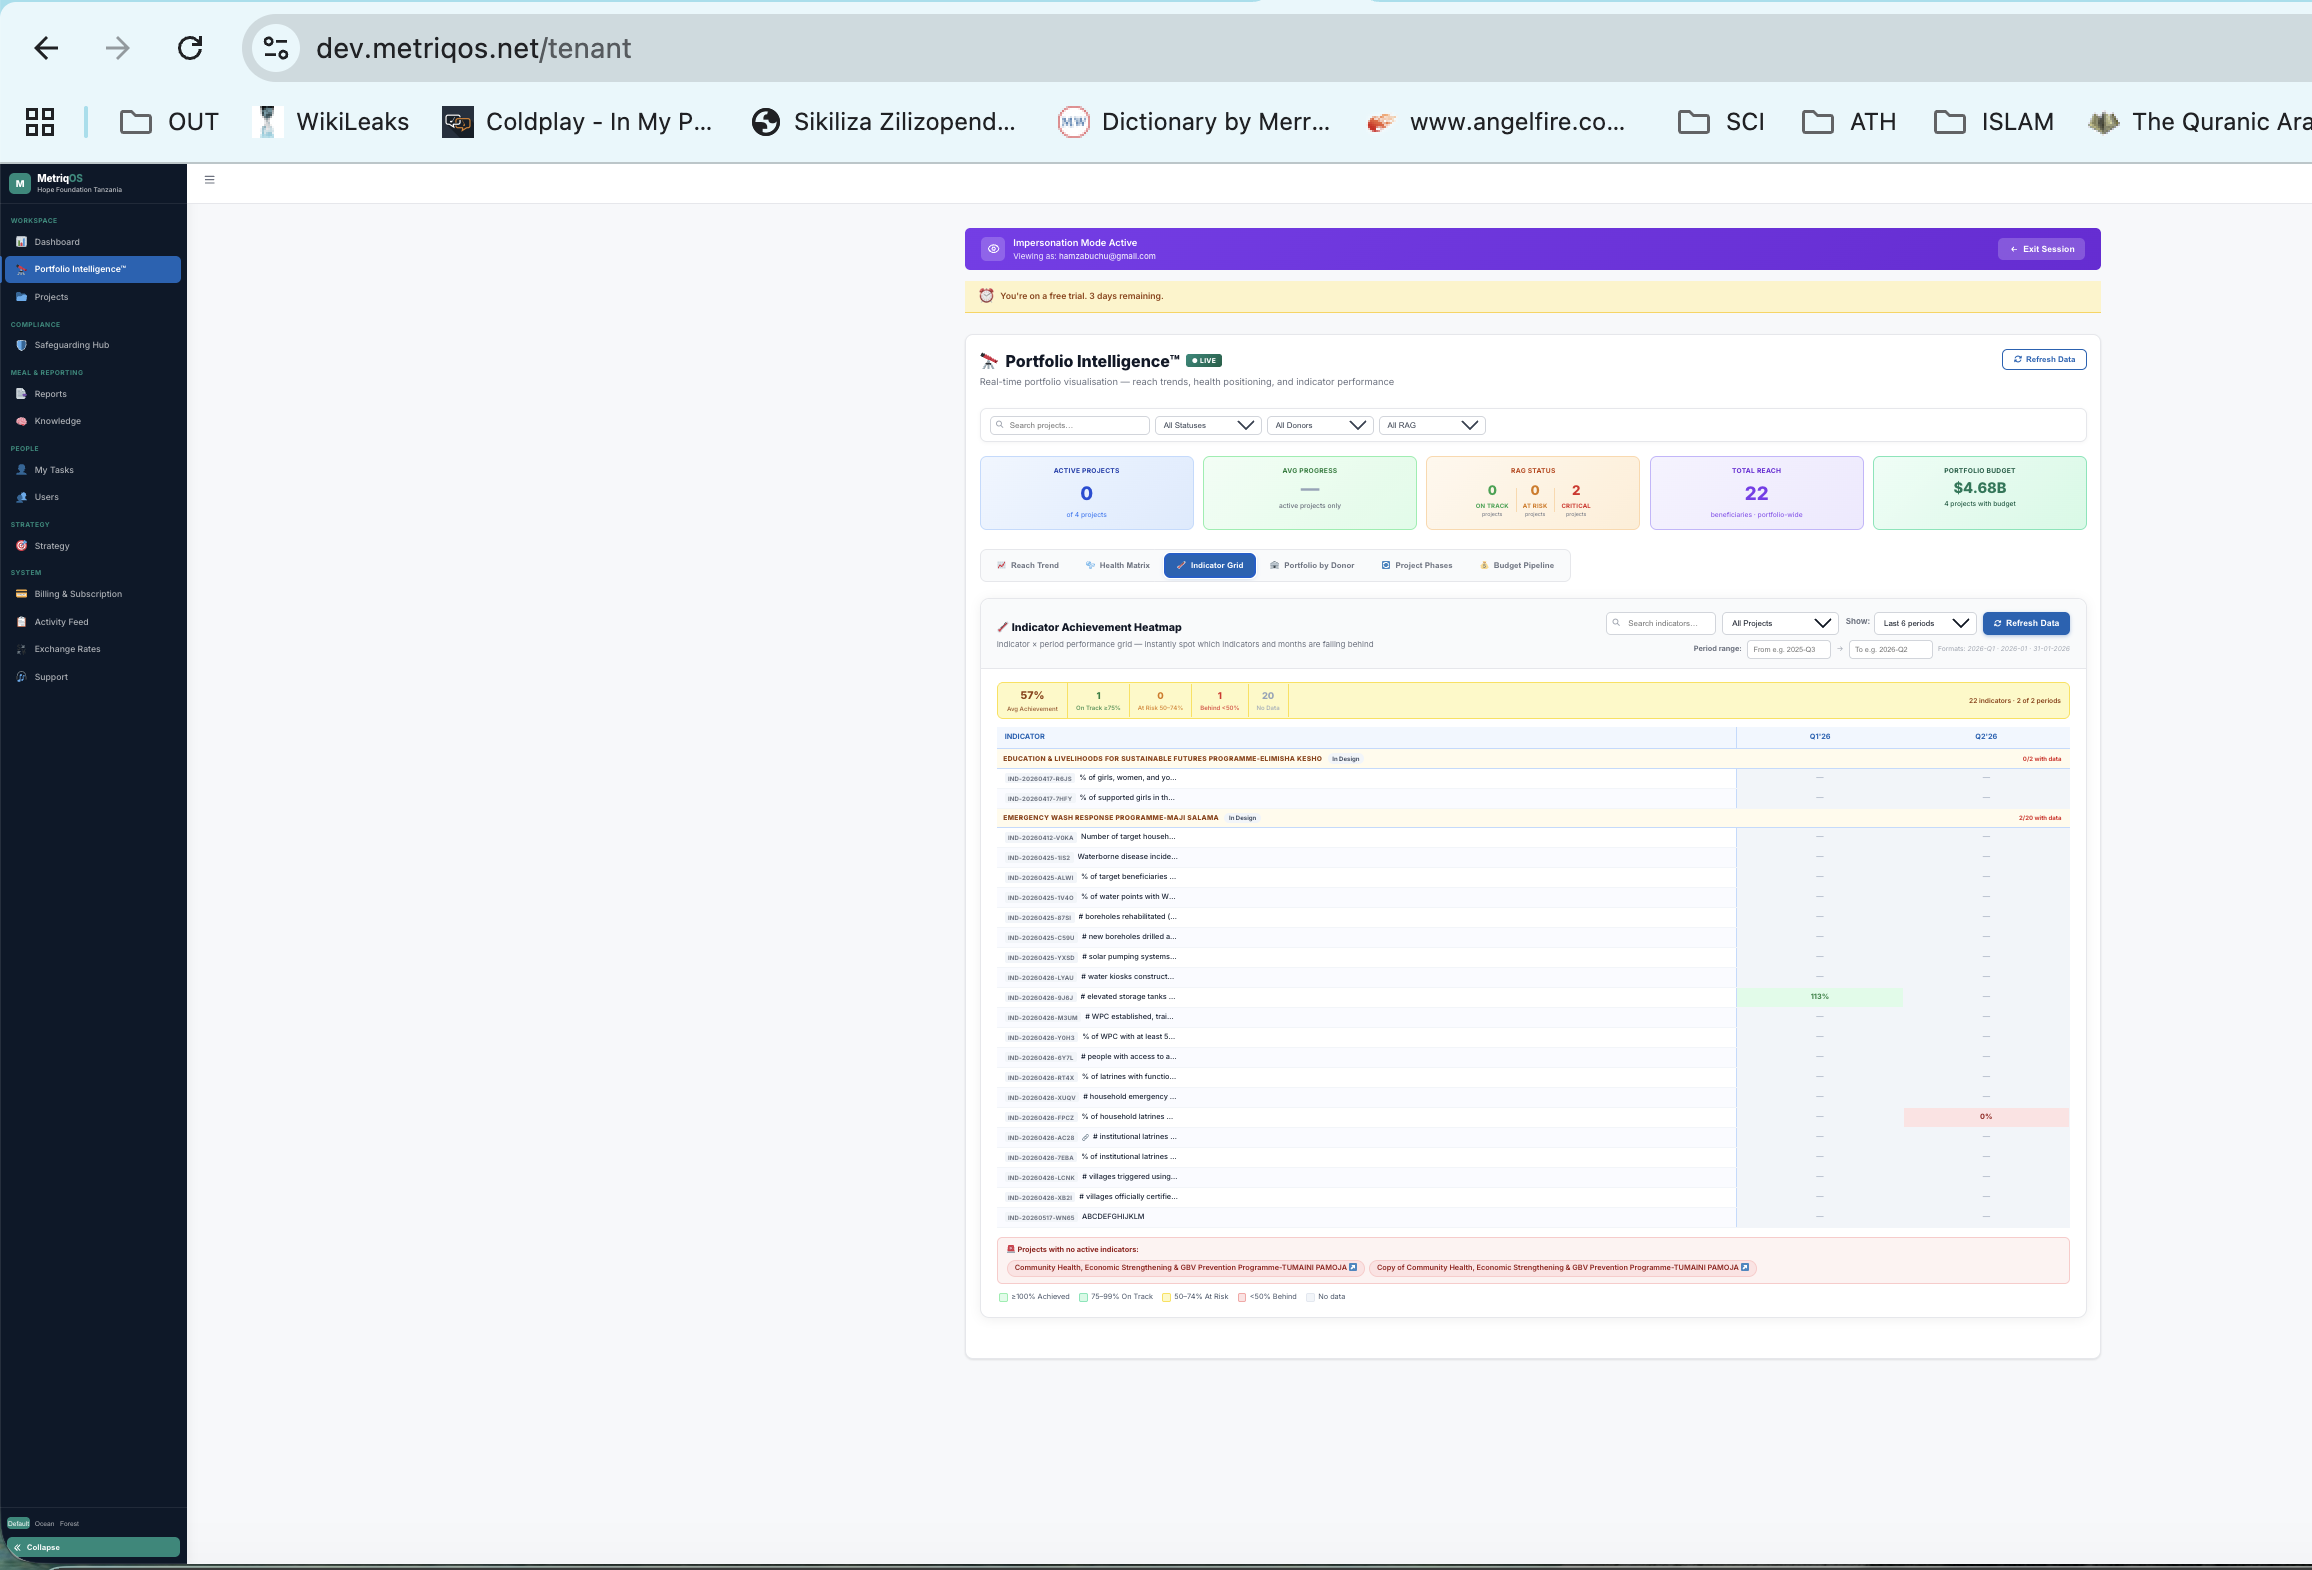
🔥
Heatmap
Indicator Grid
Cross-project indicator performance heatmap. Immediately see which outcomes are consistently under-achieved across the portfolio.
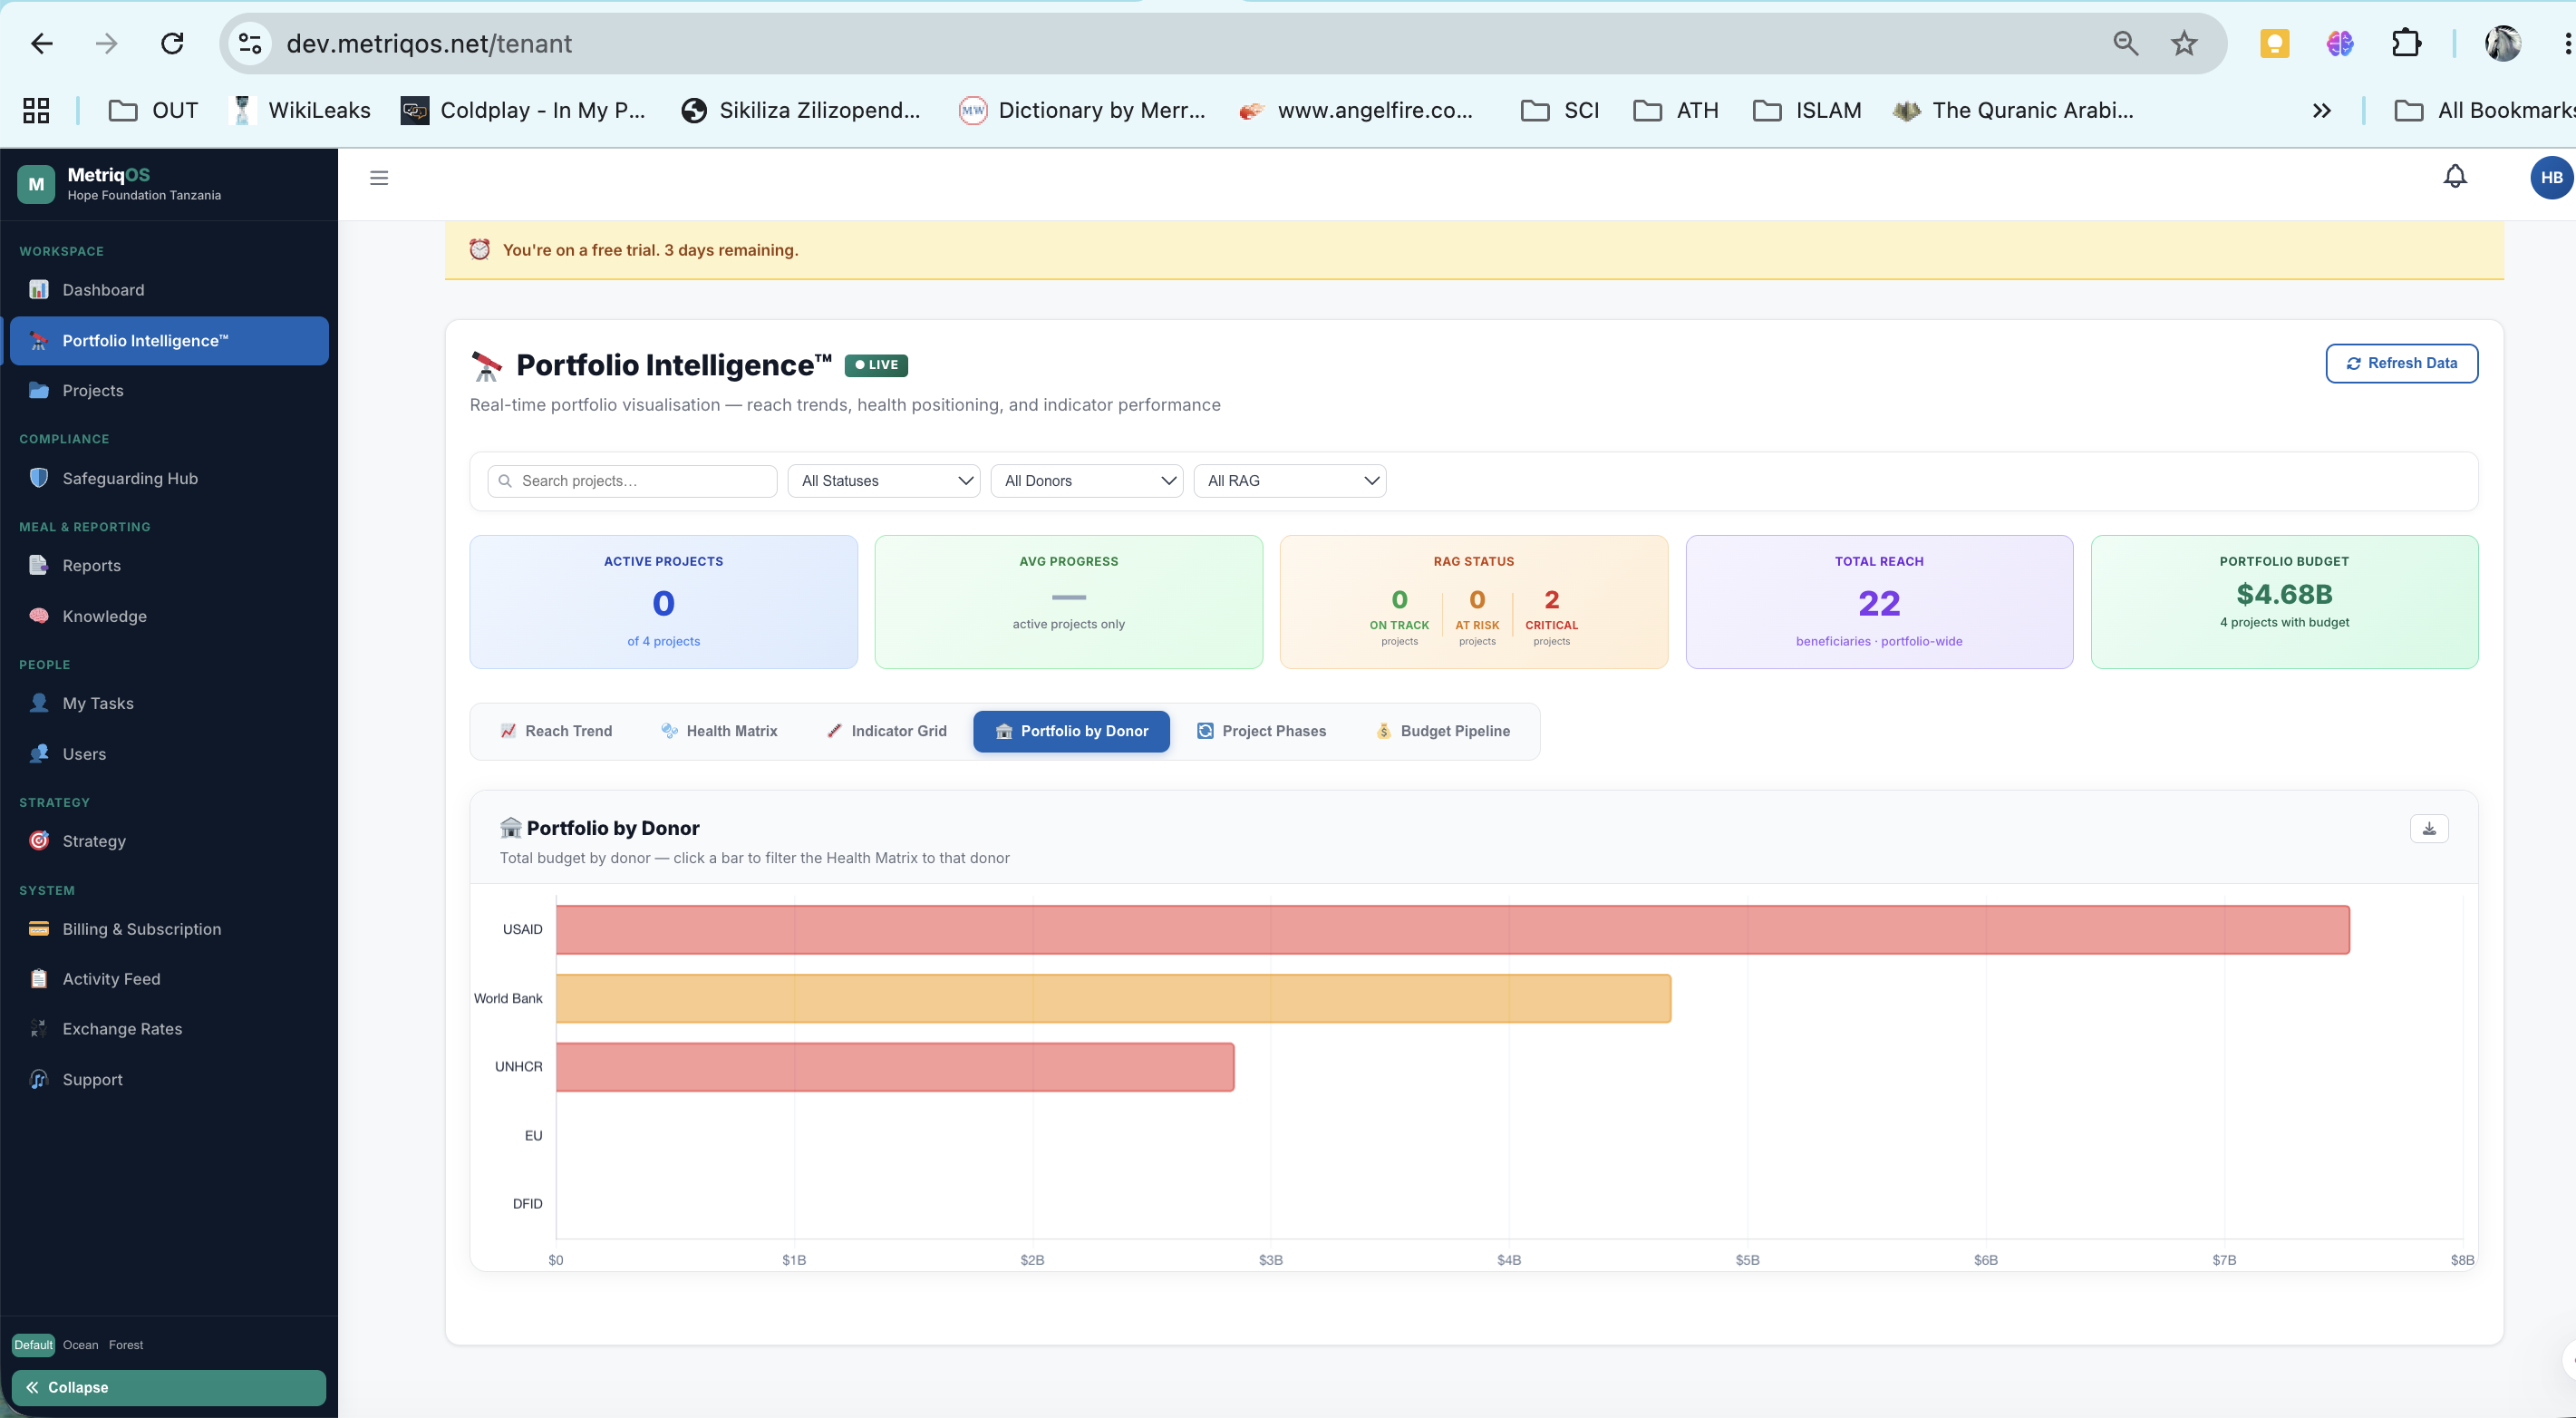
🏦
Funding
Portfolio by Donor
Which donors fund which projects. Funding concentration, expiry dates, and gaps — visible before a donor relationship is at risk.
📅
Timeline
Project Phases
All projects plotted on a single timeline. See where start-up, implementation and close-out phases overlap — for resource planning decisions.
💰
Finance
Budget Pipeline
Combined cash flow projection across all projects. When are disbursements expected? When are large procurement activities due? One view.
metriqos.net · Portfolio Intelligence · Health Matrix
Portfolio Health Matrix
metriqos.net · Portfolio Intelligence · Reach Trend
Portfolio Reach Trend
Organisation Dashboard
Every project's health
signal. One screen.
The organisation-wide dashboard is the first thing senior leadership sees on login. No drilling into project files. No waiting for a project manager's update. The signal is live.
8/10
Projects on track this week
81
Portfolio DataPulse™ average
4,218
Beneficiaries reached this quarter
1
Project requiring immediate review
metriqos.net · Organisation Dashboard
Organisation dashboard
metriqos.net · Portfolio Intelligence · Indicator Grid
Portfolio Indicator Grid
Indicator Grid
Which outcomes are under-achieved across the portfolio?
The heatmap shows performance against targets for every indicator across all projects — colour-coded. You see the pattern before any project manager writes a narrative to explain it.
🔍
Cross-project pattern detection
When the same indicator type is underperforming across 3 projects, that's a strategic issue — not a project-level one. Visible here.
📤
Export for board reporting
Export any Portfolio Intelligence view as PDF for board packs, donor updates, or internal strategy reviews.
Donor Portal
Stop sending PDFs.
Start giving access.
Your donors receive a signed portal URL — scoped exactly to what you've chosen to share. They see live programme data, not a 90-day-old summary. You control visibility. Every access is logged.
🔐
Grantee-controlled visibility
You decide which sections each donor sees — Overview, Logframe, IPTT, Reports, DIP. One toggle per section, per donor.
📋
Full audit trail on both sides
You see when the donor accessed the portal, which sections they viewed, and for how long. They see the same log on their end.
Smart Donor Hub — coming soon
When a donor funds multiple grantees on MetriqOS, a single aggregated hub URL gives them one view across all — replacing multiple separate links. Live for donor pitches on request.
metriqos.net · Donor Portal Settings
Donor Portal Settings
DataPulse™ at Scale
Quality you can
present to a board
without pre-auditing.
Your portfolio DataPulse™ score is a live aggregate of every project's data quality — run it whenever you need it, against your chosen donor frameworks. When a donor asks about data quality at your next meeting, you have a number.
No other results platform in the sector does this.
Tola Data, DevResults, Apricot — none ship an integrated on-demand DQA engine. DataPulse™ is a MetriqOS original. It is the defensible answer to "how do you know your data is good?"
Portfolio DataPulse™ Average
81
/100
10 projects · FCDO/DCED framework · Run on demand
Girls' Education
87
WASH Mara
81
Livelihoods
90
Nutrition
74
Health Systems
68
StrategIQ
Strategy isn't a document.
It's a cockpit.
StrategIQ connects your organisational strategy to your logframes, tracks implementation, measures alignment, and generates impact stories — all from data already in the system.
Cockpit
Strategic KPIs at a glance
Blueprint
Logic model and theory of change
Tracker
Strategic objective progress
Review
Periodic review workflow
Impact Stories
Evidence-backed narratives
ImpactPitch
One-page pitch from live data
metriqos.net · Portfolio Intelligence · By Donor
Portfolio by Donor
From logframe to board pack in one system
Your logframe data feeds StrategIQ. StrategIQ feeds Portfolio Intelligence. Portfolio Intelligence exports to PDF for the board. One source of truth — no PowerPoint reshuffling before every governance meeting.
The board meeting used to start
with "I'm not sure." Now it starts with facts.
Book a 45-minute executive briefing — we'll show you the portfolio view live, with your own organisational structure.
Book an Executive Briefing Request a Portfolio Demo →